Shape Constrained Inference in Toxicology
Background
Chemicals must be screened for potential impact to human health, and the National Toxicology Program uses quantitative high-throughput screening (qHTS) to test thousands of chemicals at once. Each chemical is tested at 15 increasing doses multiple times. Responses (e.g., the amount of cell death, hormone agonism, or other depending on the dataset) for each dose are recorded. These doses and their related responses form "dose-response curves" (DRCs). Then, statistical analysis can screen out potentially hazardous chemicals for further testing. Most of the data looks like this, a classic sigmoidal dose-response curve:
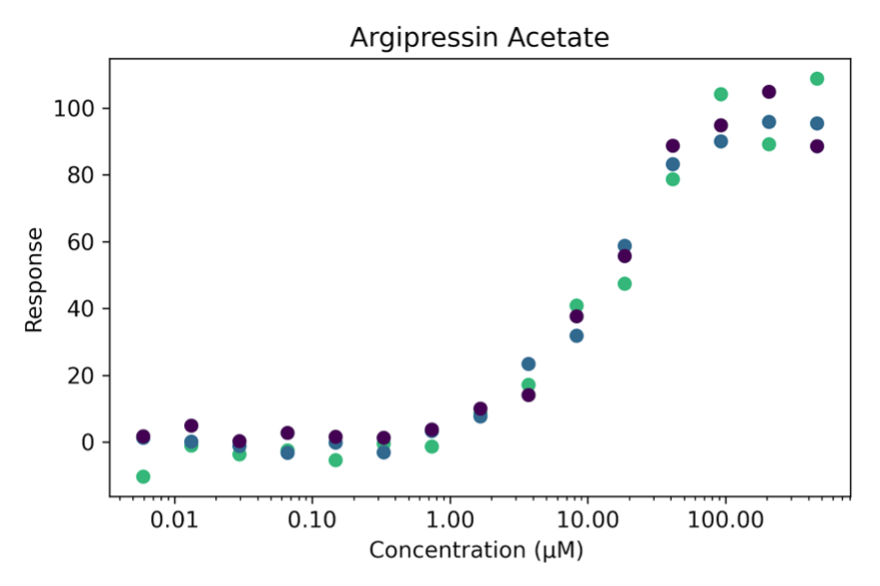
These sigmoidal DRCs are well characterized with a four parameter logistic equation, the "hill equation". This equation's parameters are useful in screening out potentially dangerous chemicals. One important parameter is EC50 (half maximal effective concentration), which is the inflection point of the sigmoid curve. However, some chemicals are non-sigmoidal:
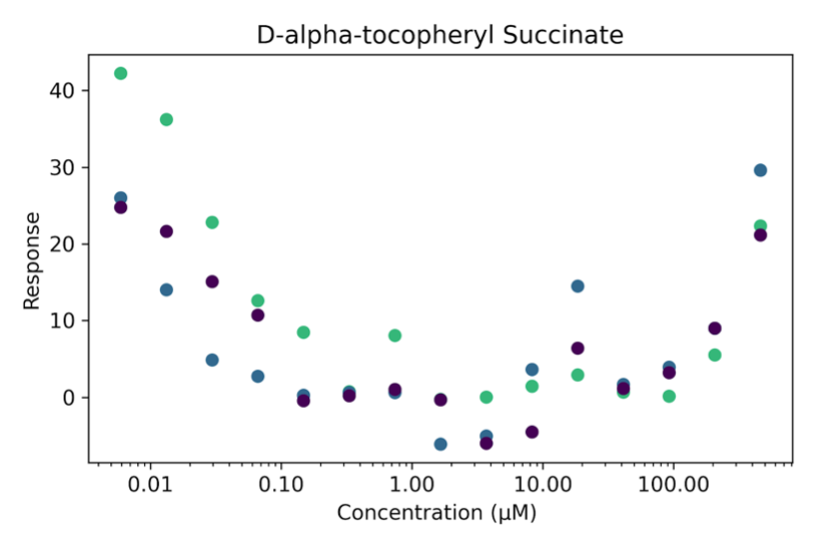
For these non-sigmoidal curves, the hill equation may not fit well and could give potentially misleading estimates of EC50. Therefore, we needed a method that could filter out non-sigmoidal curves from the dataset of thousands of chemicals for further examination. We wanted to find out how many chemicals in the dataset were non-sigmoidal, what their hill parameters were estimated as, and if there were any patterns to what kinds of chemicals these were.
Methods
I modified a semi-parametric spline based statistical method for use with qHTS datasets. This is a shape-flexible approach to model non-linear data, and fits curves to 4 different shape "kernels" (“convex”, “concave”, “increasing” and “decreasing”). This gives us a way to sort out curves by shape. Confidence intervals for deciding shape were bootstrapped, which was computationally intensive. Therefore, I implemented adaptive bootstrapping to speed up processing time which improved speed by 25%.
I used this method to sort a ~10,000 chemical dataset by shape. I compared model fit to the traditional logistic regression approach by sums of squared error (SSE).
Results
The dataset contained many different shapes, 8% of which were not sigmoidal. Logistic regression performed poorly for these shapes.
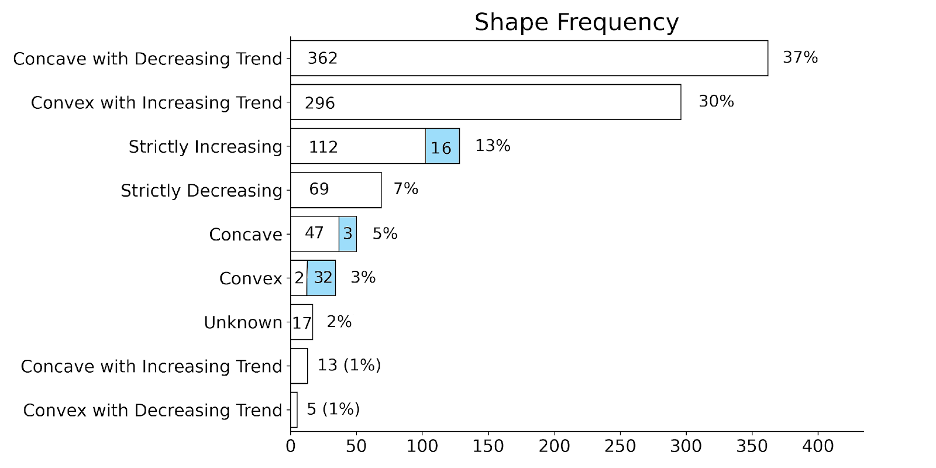
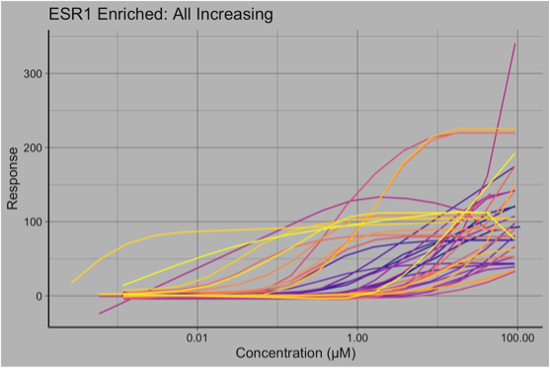
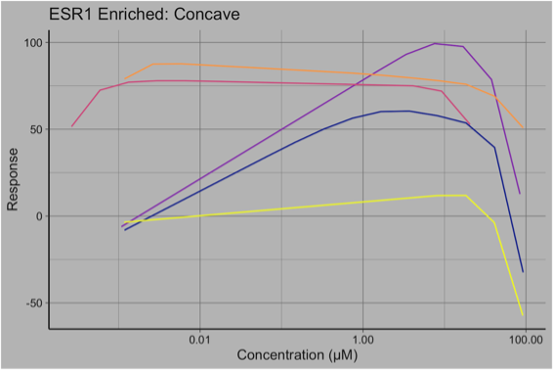
As this was an estrogen receptor dataset, the chemicals with increasing responses were heavily associated with Estrogen Receptor 1 (ESR1). Less expectedly, some “concave” chemicals were also associated with ESR1.
Filtering qHTS datasets by shape first may be a good addition to statistical workflows, allowing logistic regression to be used on the most appropriate data. Further research should be done on scientific relevance of these non-sigmoidal datasets. Are they are a result of experimental error or biology?
Many thanks to Dr. Shyamal D. Peddada and Dr. Keith Shockley at the National Institute of Environmental Health Science (NIEHS) for the opportunity at the Summer Internship Program, as well as their guidance and invaluable insight on this project.