Remote Detection of Harmful Algal Blooms
Background
Harmful algal blooms (HABs) harm the ecosystem and pose a hazard to human health. Iowa Department of Natural Resources (IDNR) tests water quality at all state park lakes and many locally managed lakes only once per week in season. This means visitors can be exposed before the next test results are processed or by visiting untested beaches. Near-daily monitoring of HABs would allow us to better understand, predict, and respond to HABs.
We hope to develop near real-time methods to detect HABs using trail cameras and satellite imagery (Landsat 8, Planet, Sentinel 1 and 2). Our test site for this project is Big Spirit Lake in Northwest Iowa. It is the largest natural lake in Iowa and a popular recreation destination.
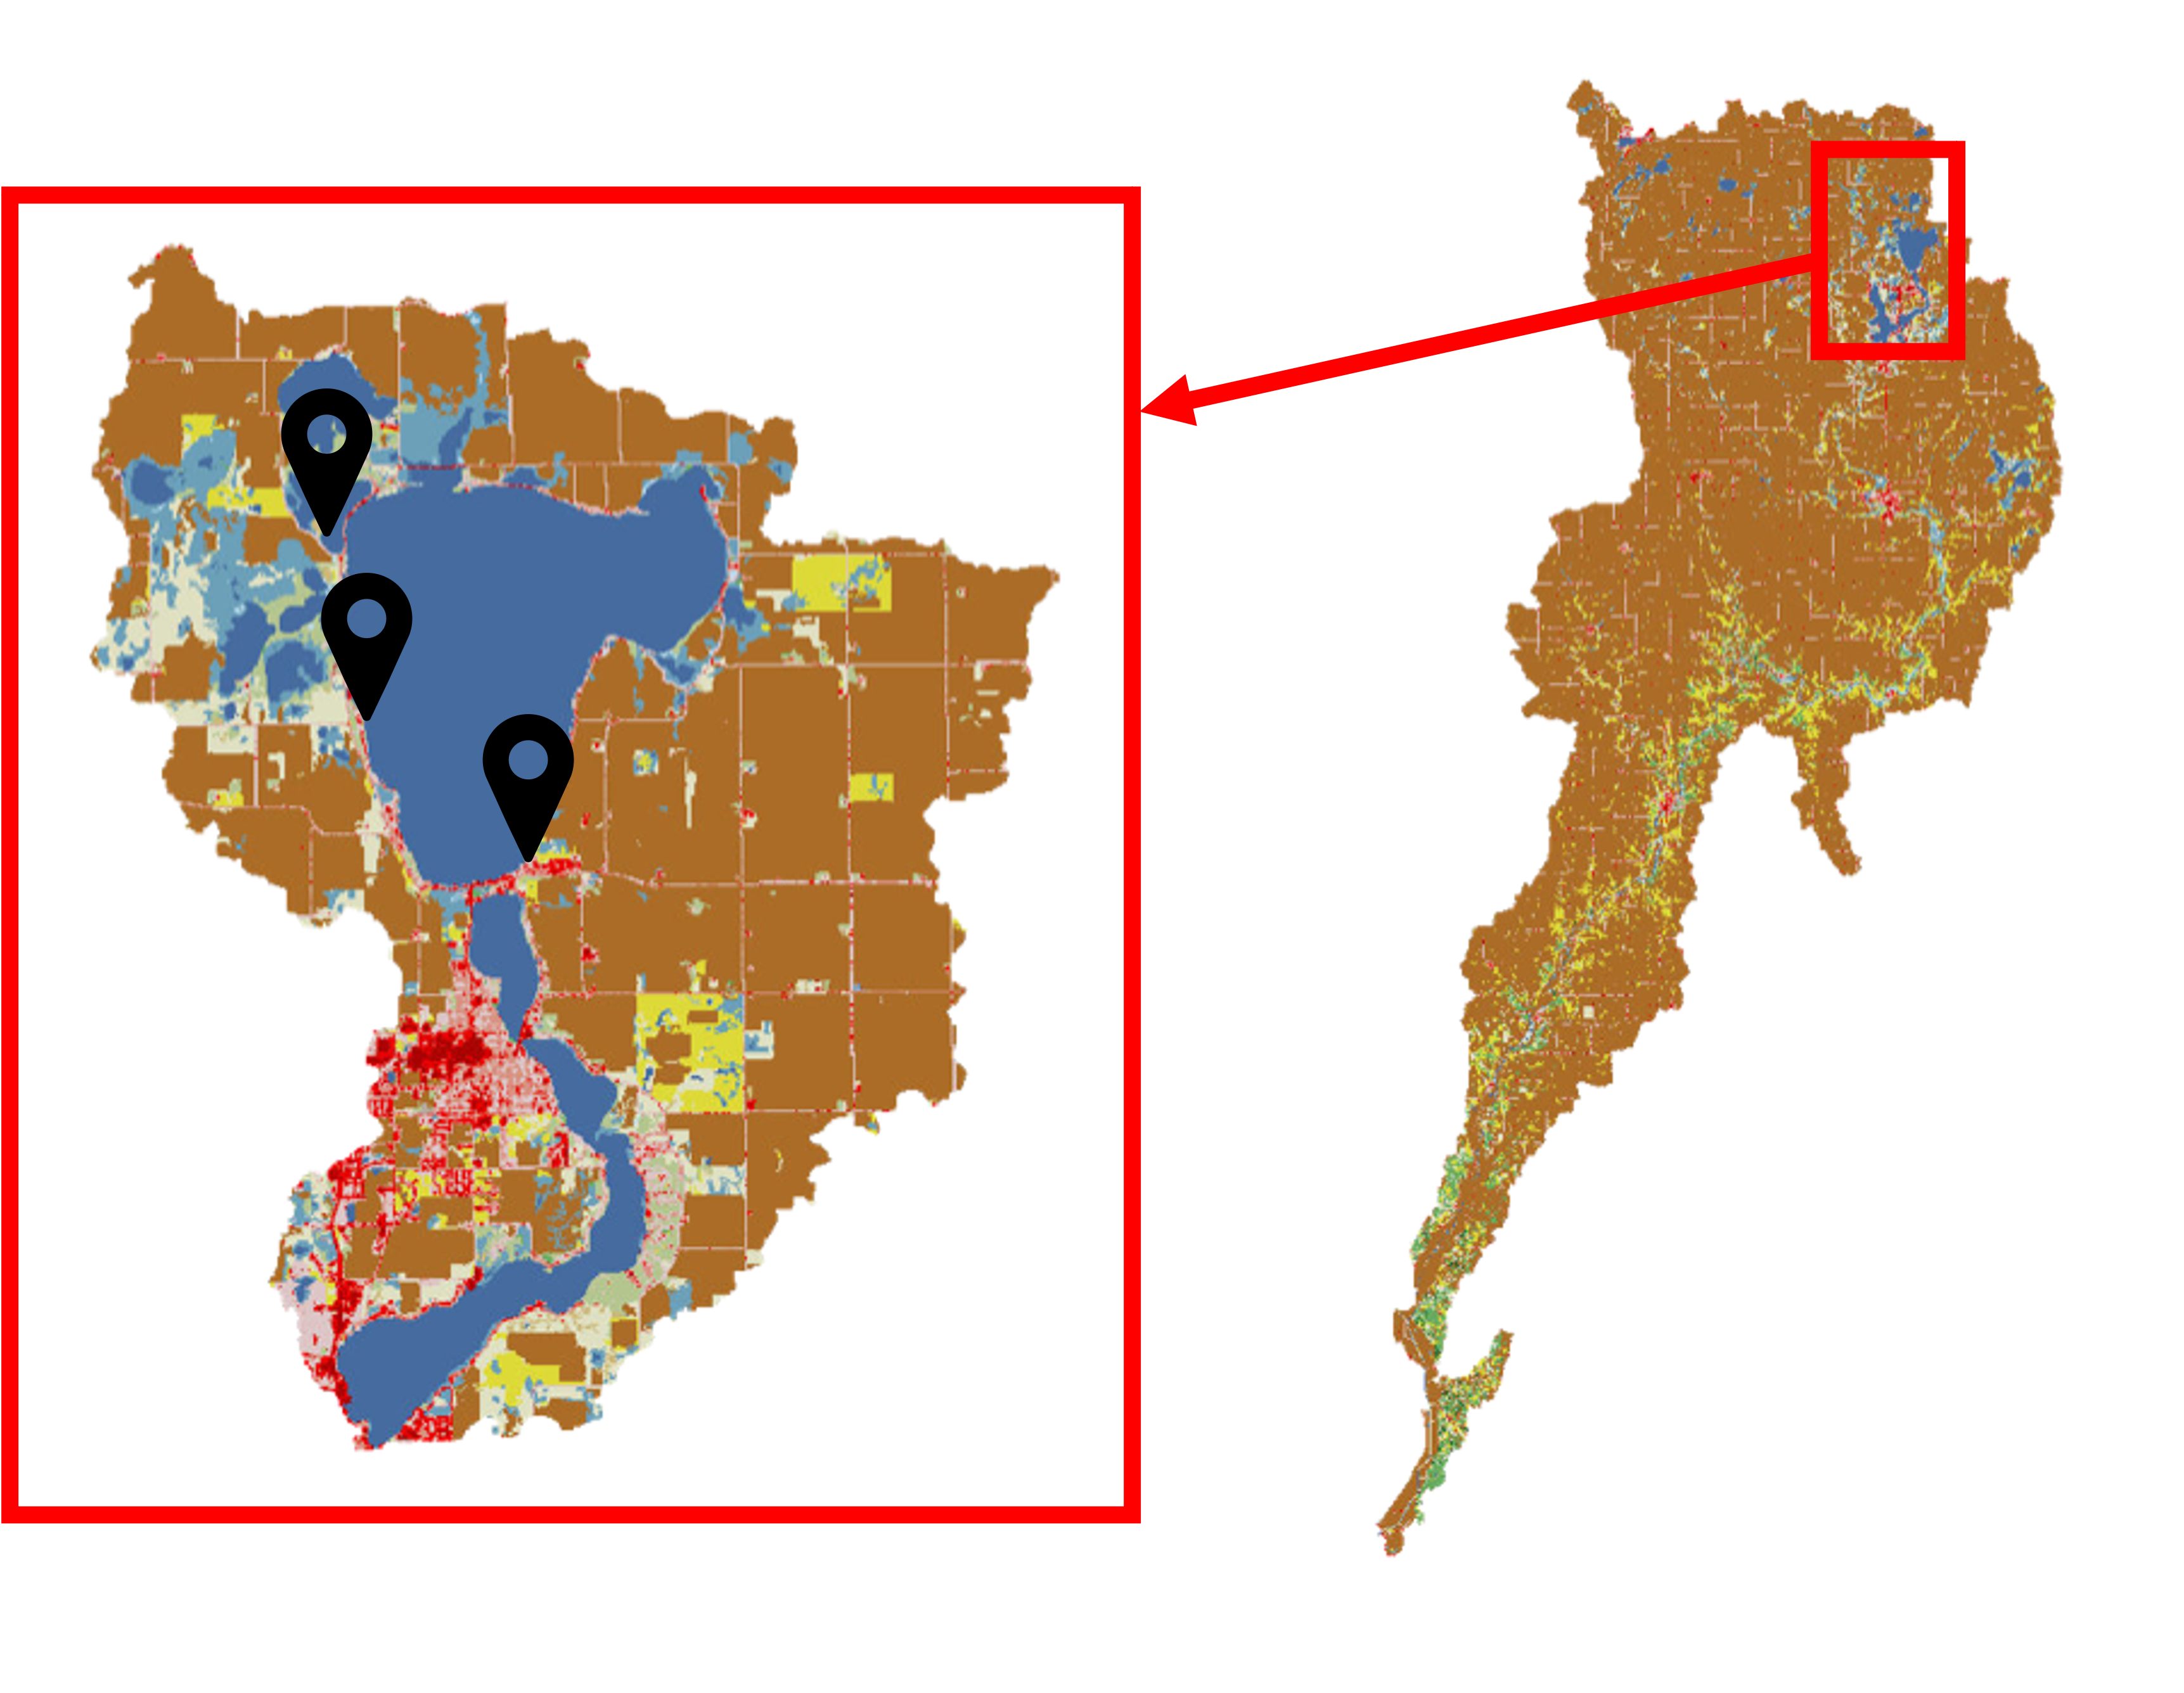
Brown denotes cultivated crops. 60% of the HUC 12 watershed is cropland (left) and ~80% of the HUC 8 (right). Crandalls, Marble, and Orleans Beach are marked from top counterclockwise. Proximity to agricultural land and related nutrient runoff may contribute to HABs.
Data
IDNR’s weekly water quality tests- Measure microcystin, a toxin produced by HABS
- Helps us understand what times of the year HABs occur
- Taken at 40 locations across the lake once monthly in June, July, August, and September of 2023
- Helps us understand how the algae is distributed in the lake
- Digital trail cameras set during 2022 at the three beach sites, images taken 5x/day
- Satellite images from the PlanetScope SuperDove constellation
- Almost daily imagery with 3-m pixels
Methods
Trail Cameras
Digital images consist of red, green, and blue (RGB) color channels that contribute to the overall color of each pixel. Each pixel’s value for a given color channel is its digital number (DN). Using python and opencv2, an initial naive approach is made to calculate greenness of the water in trail camera images. First, a region of interest is selected, then green chromatic coordinate (GCC), the relative intensity of green to other color channels, is calculated on a pixel by pixel basis and averaged over the region.
However, trail camera image processing is confounded by water reflectivity, angle of cameras, angle of sun, weather conditions and choppiness of the water, among other factors. Results are noisy and methods would need to be refined to gain any insights from trail camera images.
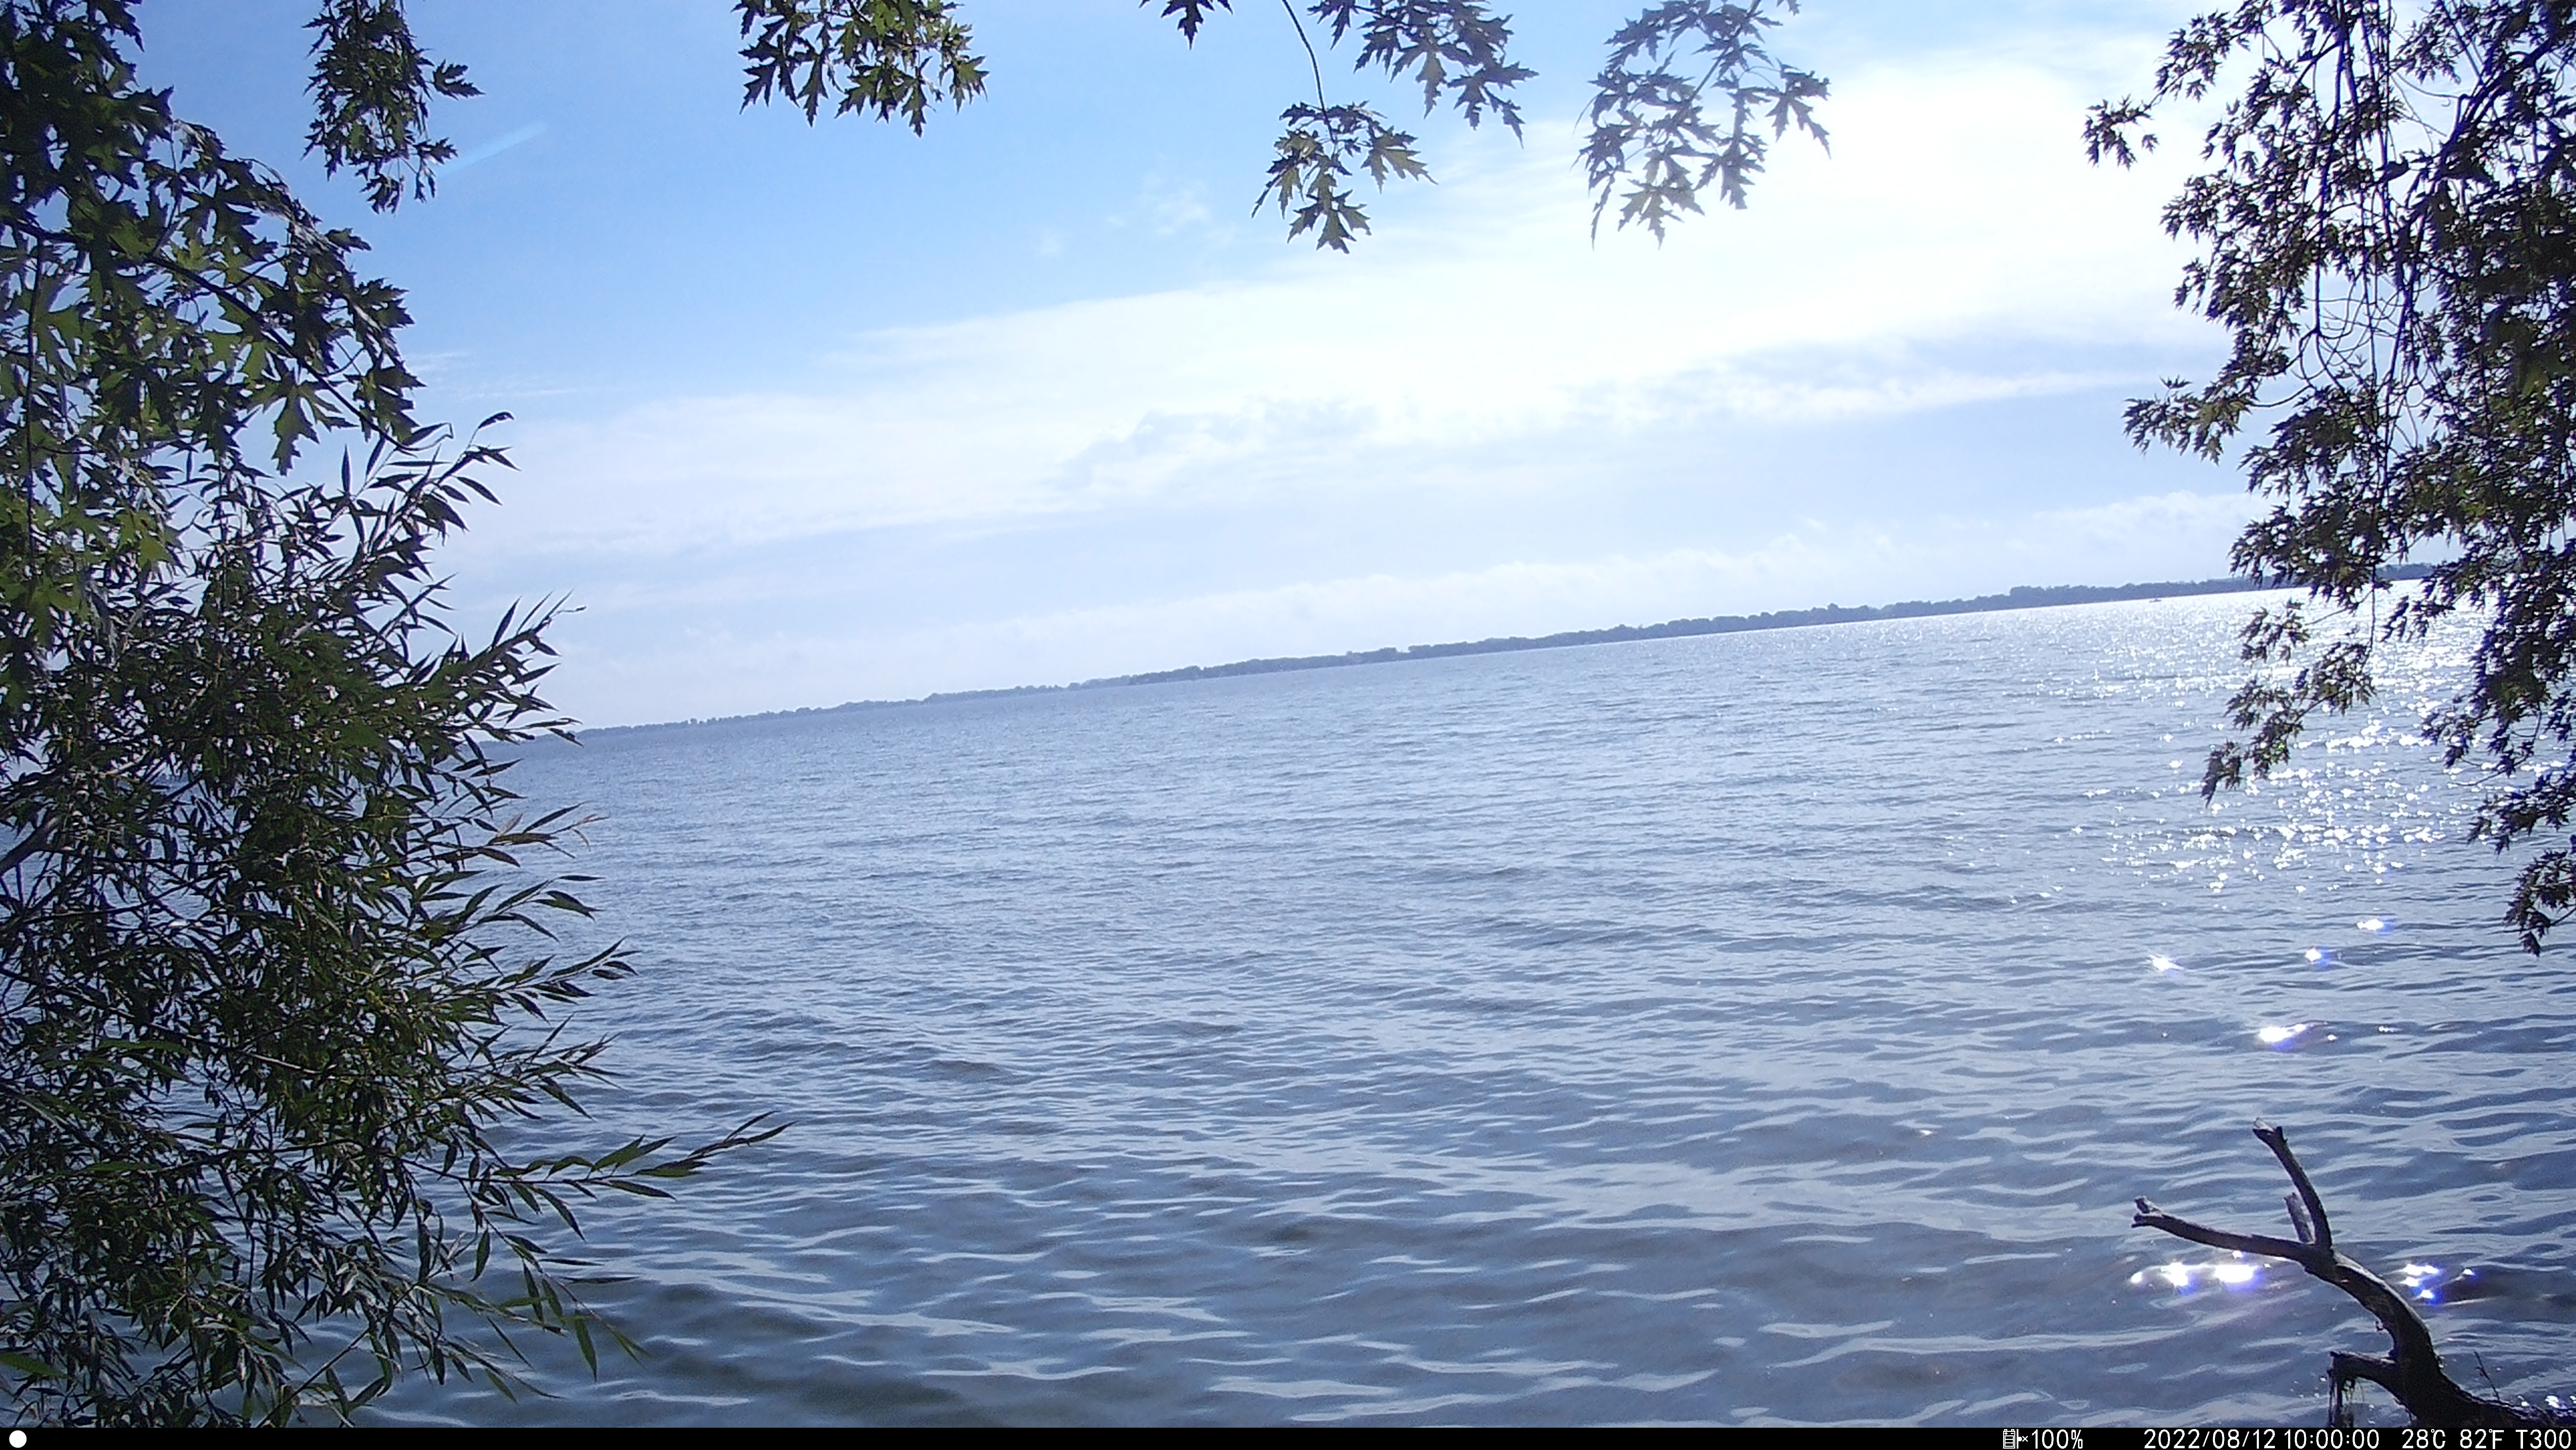
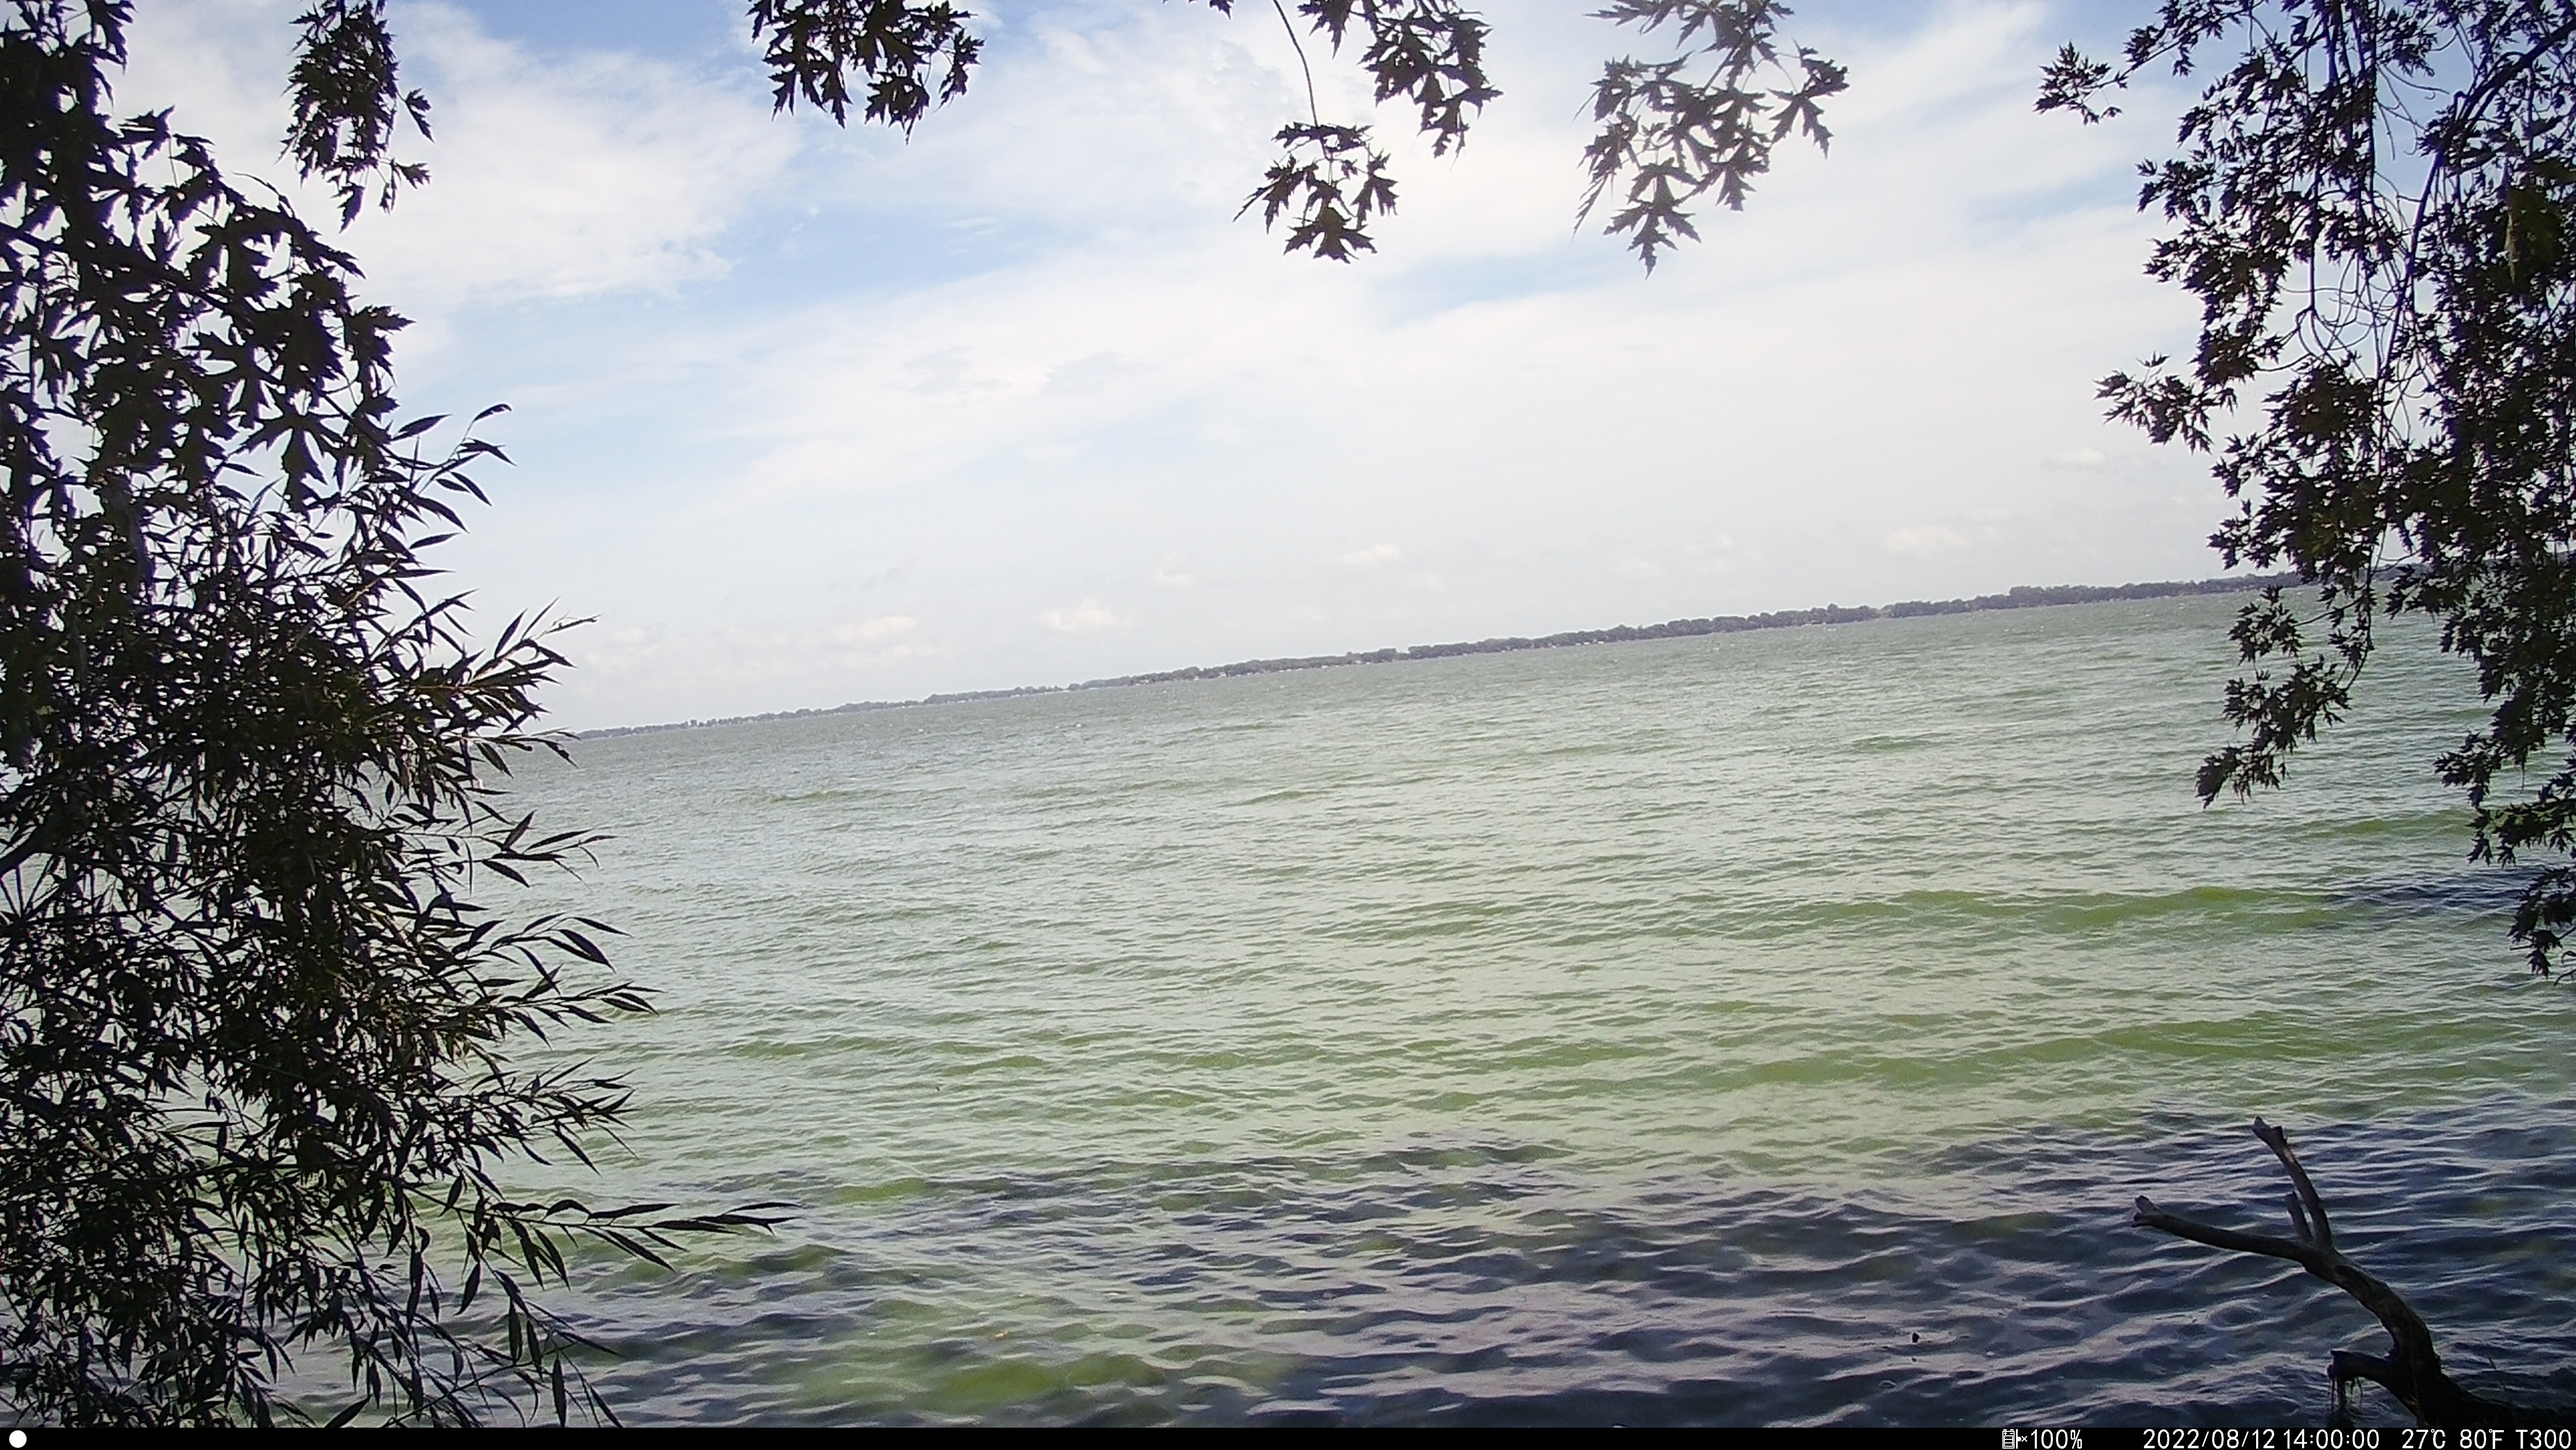
Left: Trail camera image at Marble Beach on 8-12-2022 at 11 AM. (5 days before known algal bloom, confirmed by water quality tests) Right: Image taken the SAME DAY at 3 PM, showing the differences in water appearance depending on angle of sun and water reflectivity.
Satellite Imagery
"Greenness" can be quantified using different metrics. One is the maximum chlorophyll index (MCI), which was developed for measuring seasonal vegetation changes in forests. Chlorophyl reflects a lot of near-infrared (NIR) light. Because of this, MCI was developed to detect algal blooms in turbid, eutrophic lakes. MCI is a calculation made using the radiance measurements of the bands containing 681, 709, and 753 nm wavelengths. We are also evaluating the use of NCDI as another potential spectral index.
Preliminary Results
Below shows MCI calculations during 2022 using Landsat-8 images of the lake. Darker colors indicate larger MCI (ie, "greener"). More analysis is needed, however, preliminary results show an increase in MCI around the time of the known algal bloom (8/17).